


Notebooks

Categories


Cells
Premium


BioTuring
CellRank2 (Weiler et al, 2023) is a powerful framework for studying cellular fate using single-cell RNA sequencing data. It can handle millions of cells and different data types efficiently. This tool can identify cell fate and probabilities across various data sets. It also allows for analyzing transitions over time and uncovering key genes in developmental processes. Additionally, CellRank2 estimates cell-specific transcription and degradation rates, aiding in understanding differentiation trajectories and regulatory mechanisms.
In this notebook, we will use a primary tumor sample of patient T71 from the dataset GSE137804 (Dong R. et al, 2020) as an example. We have performed RNA-velocity analysis and pseudotime calculation on this dataset in scVelo (Bergen et al, 2020) notebook. The output will be then loaded into this CellRank2 notebook for further analysis.
This notebook is based on the tutorial provided on CellRank2 documentation. We have modified the notebook and changed the input data to show how the tool works on BioTuring's platform.

BioTuring
Single-cell RNA sequencing (scRNA-seq) protocols often face challenges in measuring the expression of all genes within a cell due to various factors, such as technical noise, the sensitivity of scRNA-seq techniques, or sample quality. This limitation gives rise to a need for the prediction of unmeasured gene expression values (also known as dropout imputation) from scRNA-seq data.
ADImpute (Leote A, 2023) is an R package combining several dropout imputation methods, including two existing methods (DrImpute, SAVER), two novel implementations: Network, a gene regulatory network-based approach using gene-gene relationships learned from external data, and Baseline, a method corresponding to a sample-wide average..
This notebook is to illustrate an example workflow of ADImpute on sample datasets loaded from the package. The notebook content is inspired from ADImpute's vignette and modified to demonstrate how the tool works on BioTuring's platform.

BioTuring
Mapping out the coarse-grained connectivity structures of complex manifolds
Biological systems often change over time, as old cells die and new cells are created through differentiation from progenitor cells. This means that at any given time, not all cells will be at the same stage of development. In this sense, a single-cell sample could contain cells at different stages of differentiation. By analyzing the data, we can identify which cells are at which stages and build a model for their biological transitions.
By quantifying the connectivity of partitions (groups, clusters) of the single-cell graph, partition-based graph abstraction (PAGA) generates a much simpler abstracted graph (PAGA graph) of partitions, in which edge weights represent confidence in the presence of connections.
In this notebook, we will introduce the concept of single-cell Trajectory Analysis using PAGA (Partition-based graph abstraction) in the context of hematopoietic differentiation.
BioTuring
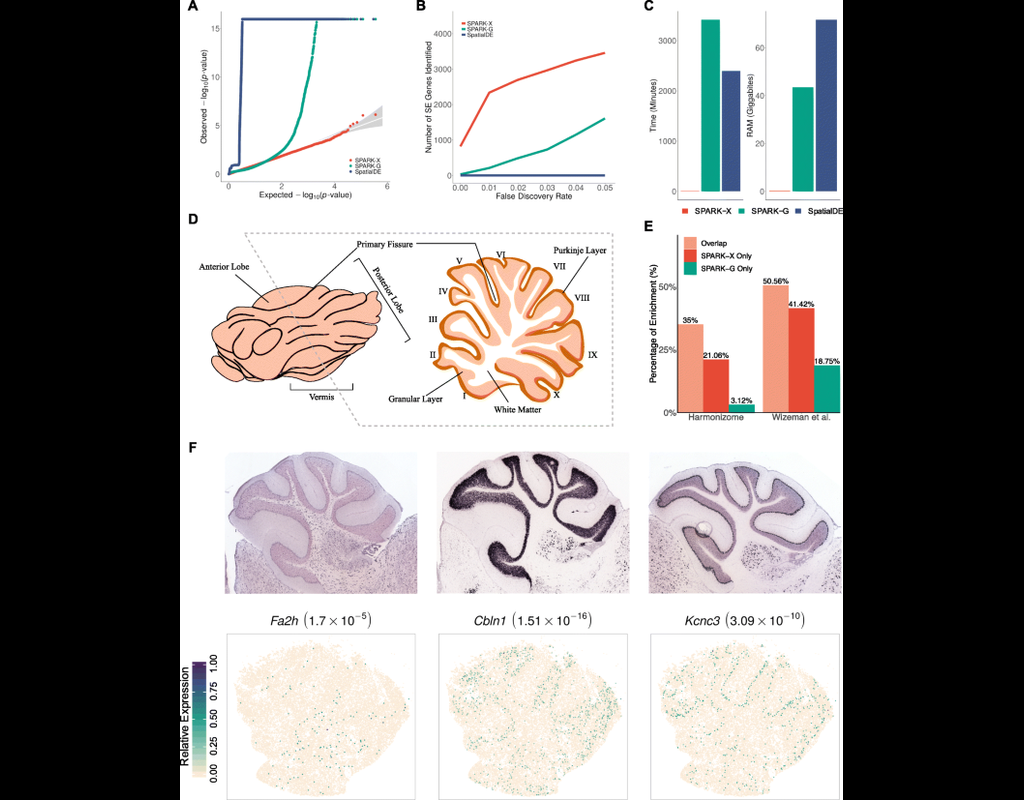
Spatial transcriptomic studies are becoming increasingly common and large, posing important statistical and computational challenges for many analytic tasks. Here, we present SPARK-X, a non-parametric method for rapid and effective detection of spatially expressed genes in large spatial transcriptomic studies.
SPARK-X not only produces effective type I error control and high power but also brings orders of magnitude computational savings. We apply SPARK-X to analyze three large datasets, one of which is only analyzable by SPARK-X. In these data, SPARK-X identifies many spatially expressed genes including those that are spatially expressed within the same cell type, revealing new biological insights.
Trends
BioTuring
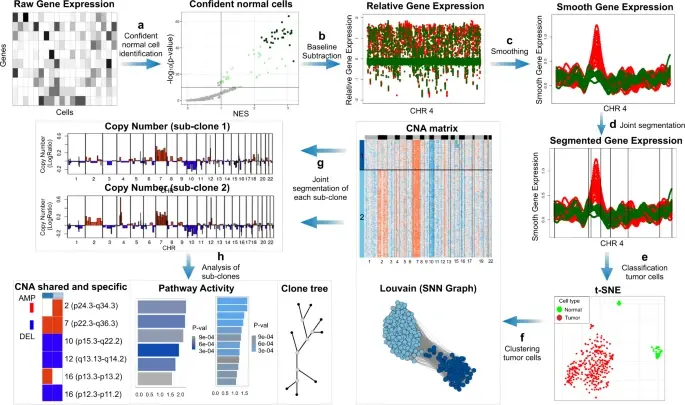
In the realm of cancer research, grasping the intricacies of intratumor heterogeneity and its interplay with the immune system is paramount for deciphering treatment resistance and tumor progression. While single-cell RNA sequencing unveils diverse t(More)